Project case study
Tumour segmentation
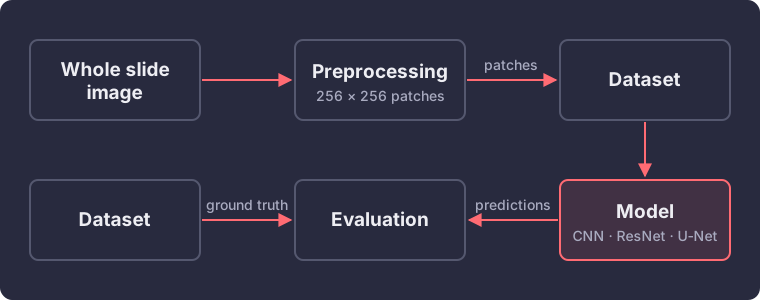
Finding tumour regions in tissue images with U-Net, alongside CNN and ResNet patch classifiers.
View project on GitHubPipeline
Example segmentations
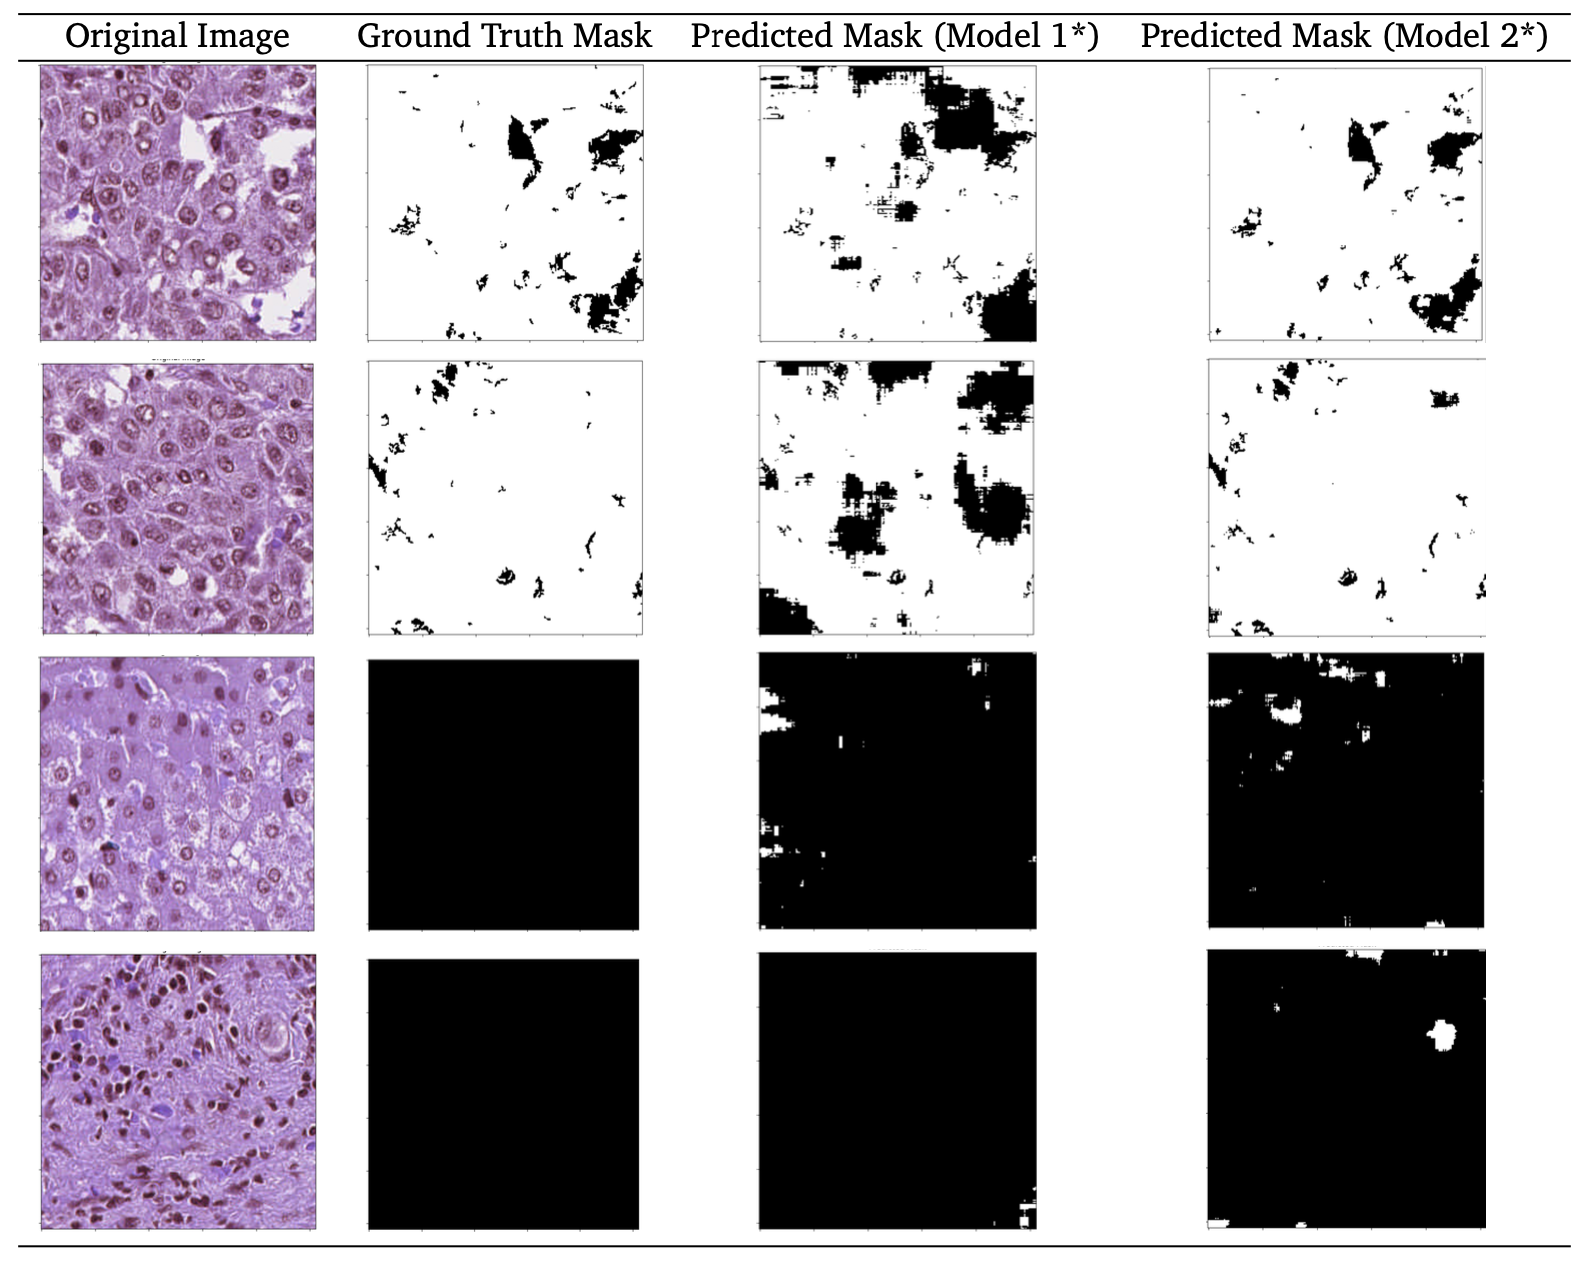
Open full-size comparison. Swipe horizontally on mobile, or focus the figure and use arrow keys.
Results
U-Net results on slides 46 to 50, by number of training slides and the tumour share of the training data.
| Training slides | Training mix | Mean IoU | Accuracy | F1 | Recall | Precision |
|---|---|---|---|---|---|---|
| 20 | 50% tumour | 40.7% | 70.4% | 68.7% | 60.9% | 72.3% |
| 20 | 67% tumour | 40.7% | 70.3% | 64.2% | 55.6% | 53.3% |
| 20 | 100% tumour | 18.8% | 37.7% | 29.2% | 87.5% | 37.7% |
| 45 | 50% tumour | 24.2% | 48.5% | 41.0% | 35.5% | 100.0% |
| 45 | 67% tumour | 46.9% | 82.8% | 85.7% | 84.5% | 41.1% |
| 45 | 100% tumour | 15.7% | 31.5% | 27.9% | 100.0% | 31.5% |
Balance decides the result. Training only on tumour data overfits to tumour, scoring zero on benign tissue. With 45 slides, a 50/50 mix swings the other way, because the larger set holds many more benign patches. The strongest result came from 45 slides with two-thirds tumour data.
Muhanad Tuameh · Emre Arslanoğlu
Models and notebooks
PyTorch CNN, ImageNet-pretrained ResNet18, and TensorFlow/Keras U-Net.