Project case study
Mapping bacterial colonies
Clustering bacterial transcripts on human lung tissue to find and label colonies, from 10x Xenium spatial data.
Built for the Bryant Group at the Wellcome Sanger Institute to support studies of bacterial colonies in lung tissue affected by smoking. The Xenium Analyzer records where each transcript sits on the tissue. A custom panel targets genes from 11 bacterial species, so groups of nearby bacterial transcripts can mark a colony.
From transcripts to colonies
- Select bacterial transcripts. Keep custom-panel transcripts and map each gene to its species.
- Pick a distance. Measure distances between nearby transcripts and choose a clustering threshold automatically.
- Cluster. Group transcripts by position with single linkage or HDBSCAN. A colony needs at least two transcripts.
- Label each colony. Assign a species or mark it mixed, using marker-gene rules.
- Explore. An interactive app shows clusters, tissue cells, and per-cluster breakdowns.
Two clustering methods
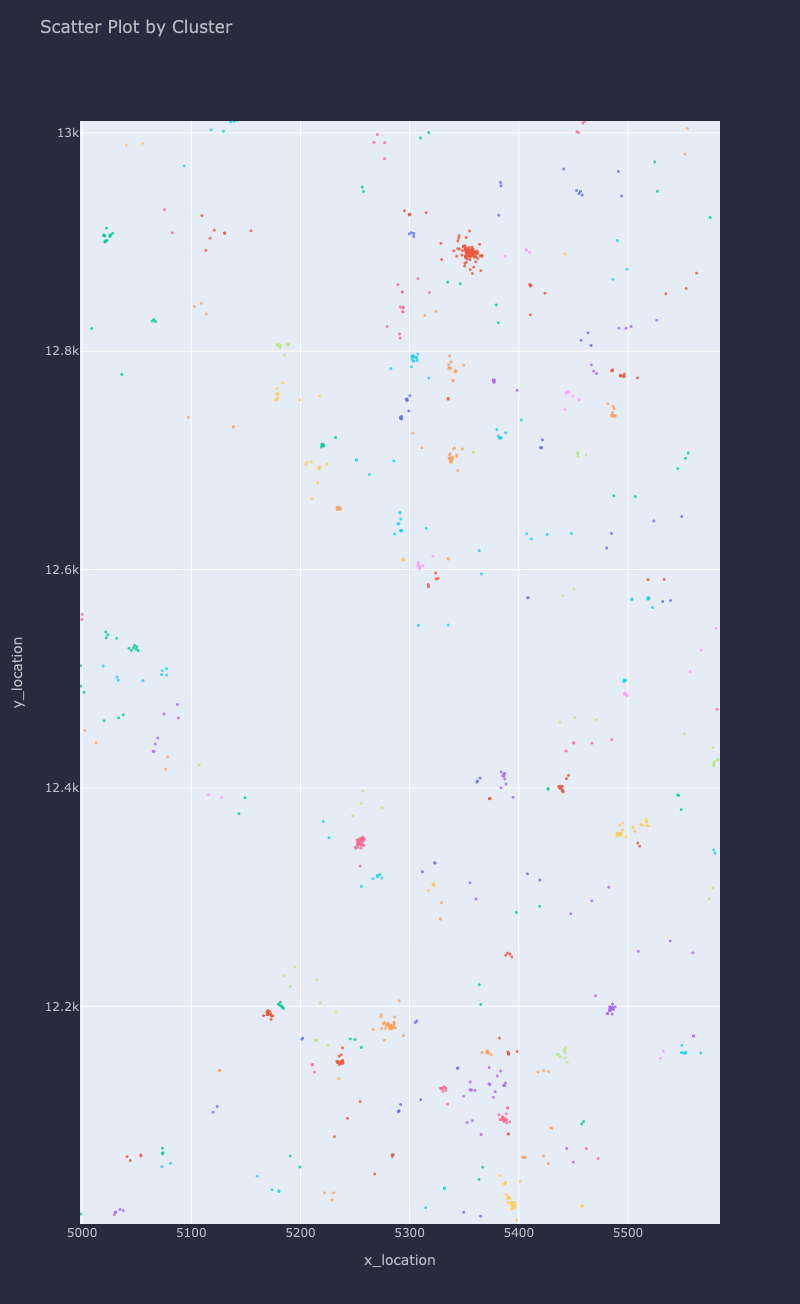
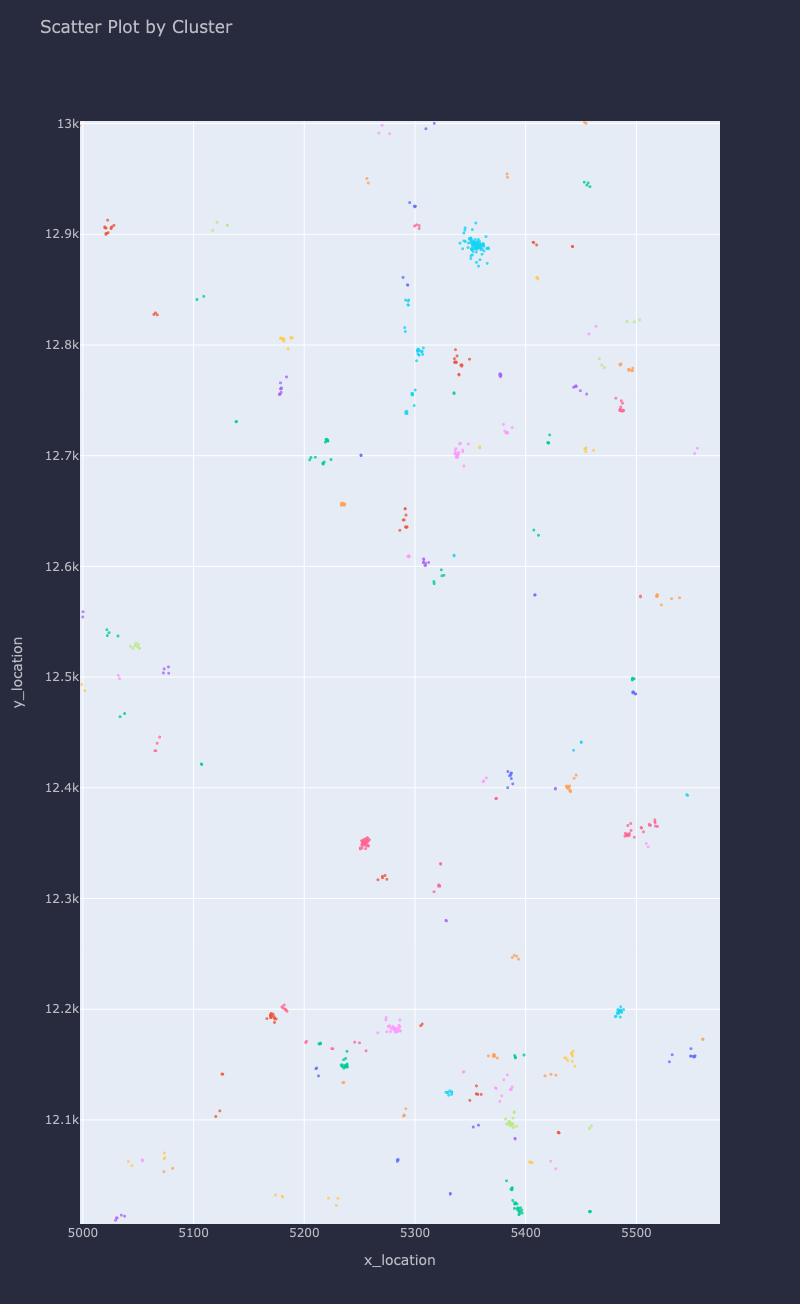
The same tissue region clustered both ways. Each colour is one cluster.
- Transcripts
- 148,858
- Unclustered, single linkage
- 65,000
- Unclustered, HDBSCAN
- 12,592
Single linkage joins any two transcripts closer than the threshold, a hard cutoff that leaves over a third unclustered. HDBSCAN builds clusters from local density and uses the threshold only to merge nearby clusters, so it keeps far more transcripts. Neither can be scored directly, because the data has no clear ground truth. The better method depends on the scientist’s purpose: HDBSCAN suits studies that need as many transcripts as possible kept in colonies, while single linkage applies a strict distance cutoff.
Labelling colonies
A cluster is mixed when no species makes up 75% of its transcripts. Otherwise it is named after that species only if it contains a marker transcript for that species plus at least one other gene from the same species. Clusters that fail this check are kept as unassigned single-species colonies.
Interactive explorer and implementation
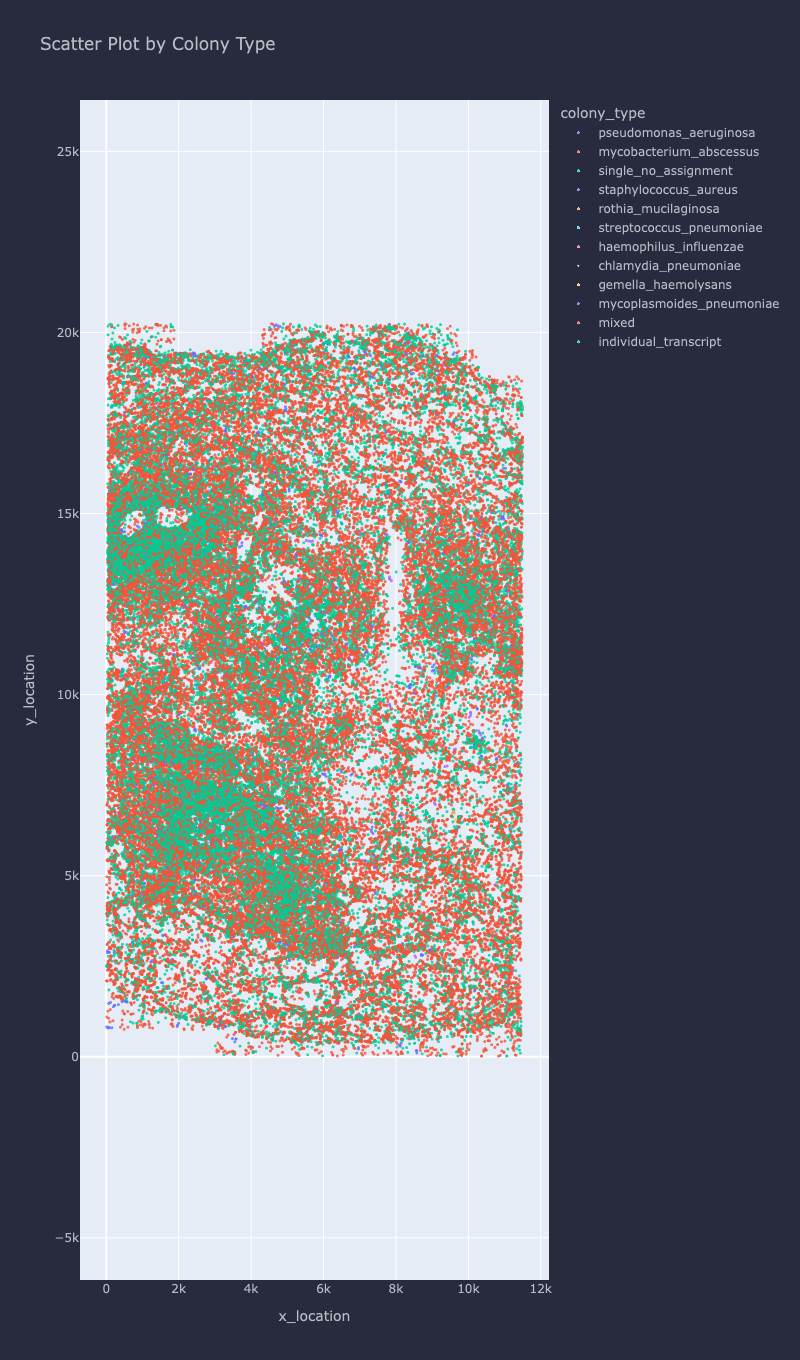
A Dash app loads a results folder and draws each cluster as its outline. Tissue cell boundaries appear once the view is zoomed in below about 2,000 µm. Clicking a cluster shows which species it contains, and clicking a species shows its genes.
Python with pandas, SciPy k-d trees and convex hulls, scikit-learn HDBSCAN, Plotly, and Dash. Species gene lists and marker rules live in a configuration file, so the panel can change without code changes. Clustering can also run separately for each species.